Plymouth
Review of Work Completed by CDMN to Date
Since 2011, there have been three diamond drill programs on the Plymouth Deposit to produce an updated NI 43-101 Resource Report. In Summer 2011, five DDHs were sunk into the Plymouth Deposit to recreate the MRR project in 1987. In Winter of 2013, 15 DDHs were sunk into the Plymouth Deposit to determine the size and shape of the Fe-Mn mineralization on a Georeferenced map and produce an updated NI 43-101 Resource Report. Between 2021 and 2022, 25 DDHs were sunk into the Plymouth Deposit in between the mapped cross-sections from the 2013 drilling project. This was done to further refine the correct tonnage and grade of the Plymouth Deposit. Most recently, in summer of 2022, 4 DDHs were sunk into a southeast portion of the North Hartford Deposit (CDMN press release, 2022).
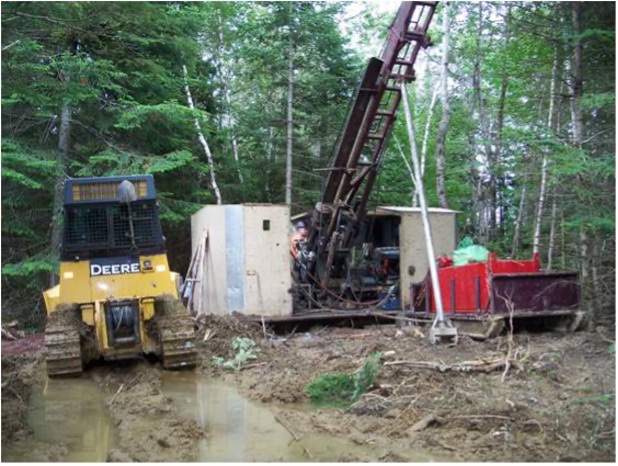
Figure 5: Drilling project on the Plymouth Deposit in the July of 2011 (Courtesy of Melissa Lambert, 2011).
In 2010, Tetra Tech (formerly Wardrop Engineering Inc.) was engaged to review and update the two processes that had generated positive operating margins in the earlier work carried out by Witteck. Results of the Tetra Tech study were for internal working purposes only but were succeeded by more comprehensive economic and hydrometallurgical reviews undertaken by Thibault and Associates Ltd. (Thibault).
In 2011, a five-hole (1,040 m) core drilling program was completed and further work by Thibault was focused on bench scale hydrometallurgical testing to confirm and optimize the process for leaching manganese from typical mineralization.
In 2013, 15 additional diamond drill holes were completed (4,082 m) along 7 section lines separated by intervals of approximately 100 m along the length of the deposit. The drilling programs account for the majority of drill hole and analytical data used in the current mineral resource estimate. However, Mercator also included validated results for 6 surface historical diamond drill holes completed in 1985 and 1987 (1,040 m) and two trenches competed in 1987 by a previous operator that were incorporated as horizontal drill holes.
Results of the 2011 and 2013 drilling programs demonstrate continuity of deposit extent and grade consistency across significant mineralized widths. Examples of representative intercepts from different deposit areas include:
11.41% Mn over 45.0 m in hole PL-11-006;
11.43% Mn over 89.0 m in hole PL-11-007;
11.28% Mn 217.4 m in hole PL-13-022A; and
9.32% over 202.0 m in PL-13-020.
Mercator prepared a mineral resource estimate based on the validated drilling and trenching results in 2013 and subsequently updated this estimate in 2014 to support a Preliminary Economic Assessment (PEA) of the Plymouth Deposit that was prepared by Terta Tech. Tetra Tech, Thibault and Associates Inc. (Thibault) and Mercator contributed to this assessment and the associated NI 43-101 Technical Report.
Resource Estimate
The Plymouth Deposit historically was estimated at 51,000,000 tonnes; 13.3% Fe and 10.9% Mn by a 23 DDH between 1954 and 1957 (Table 1). In 2021, the updated NI 43-101 technical report estimated the inferred resource at 43,070,000 tonnes at 14.32% Fe and 10.01% Mn at a 5% cutoff grade (Table 2). The North and South Hartford deposits were mapped 1957 and each one was estimated at 50,000,000 tonnes with a grade of 12% Fe and 8% Mn (Table 1). These historical estimates were based on a 13 DDH drilling program on the North Hartford Deposit and a 9 DDH drilling program done between 1954 and 1957 (Sidwell, 1957). Currently there are no NI 43-101 technical reports on either one of the Hartford deposits.
The mineral resource estimate, outlined in the 2021 NI 43-101 Technical Report, was based on validated results of the 2011 and 2013 drilling programs, plus validated results of five drillholes and two trenches completed in 1987. The mineralized zone was modeled as a folded, stratiform manganese-iron deposit occurring within a northeast striking, steeply dipping host sequence of red and grey siliciclastic sedimentary rocks using GEOVIA (formerly Gemcom) Surpac™ (Surpac™) version 6.4.1 deposit modeling software.
Drilling-defined mineralization within the resource estimate block model occurs along a 700 m strike length and reaches a maximum width of approximately 200 m in the central deposit area. Inverse Distance Squared (ID2) interpolation methods and 3 m downhole assay composites were used to assign manganese, iron, and specific gravity values within the block model, with block dimensions of 10 m (x) by 10 m (y) by 10 m (z). Capping of metal grades was not deemed necessary. Metal grade assignment was peripherally constrained by two separate wire-framed solid models based on sectional geological interpretations for the deposit and a minimum included grade
of 5% manganese over 12 m in the respective downhole direction of each drillhole. The predominant manganese mineral in the deposit is manganese carbonate (MnCO3). AGP Mining Consultants Inc. (“AGP”) provided pit optimization services that defined a cut-off value of 5% manganese for definition of mineral resources within the pit shell. This reflected conceptual production of 50% MSM and 50% HPMSM at a manganese total recovery factor of 85% and long-term prices of $1500/tonne and $935/tonne for HPMSM and MSM, respectively.
Table 1: Historical Tonnage and grades estimated for the CDMN properties. (Sidwell, 1957; Potter 1983)
| Type | Mn % Cut-off | Category | Rounded Tonnes | Mn % | Fe % |
| Open Pit | 5 | Inferred | 43,070,000 | 10.01 | 14.32 |
| Open Pit | 6 | Inferred | 41,120,000 | 10.22 | 14.57 |
| Open Pit | 7 | Inferred | 37,950,000 | 10.53 | 14.92 |
| Open Pit | 8 | Inferred | 33,560,000 | 10.93 | 15.36 |
| Open Pit | 9 | Inferred | 28,640,000 | 11.34 | 15.83 |
| Open Pit | 10 | Inferred | 22,330,000 | 11.86 | 16.42 |
Table 2: Previous Inferred Tonnage and grades with various cutoff grades for the Plymouth Fe-Mn Deposit from the 2021 NI 43-101 Technical Report (Ténière et al., 2021).
Notes:
This table shows sensitivity of the November 10, 2021, mineral resource estimate to cut-off grade. The base case at a cut-off value of 5.00% manganese is bolded for reference.
On March 23, 2023 the company reported the results of an updated independent, pit-constrained, Mineral Resource Estimate (“2023 MRE”) on Plymouth. The 2023 MRE was prepared by Mercator Geological Services Limited (“Mercator”) in accordance with Canadian Securities Administrators’ National Instrument 43-101 (NI 43-101) and the 2014 CIM Standards and includes results of the Company’s most recent (2021-2022) deposit delineation drilling program. This drilling program was specifically designed to infill on previous drilling to maximize conversion of 2021 Inferred Mineral Resources to Measured and Indicated status in the 2023 MRE. It also included several resource expansion drill holes that targeted down-dip extensions of the central deposit area, where greatest modelled thicknesses of mineralization grading above 5% Mn occur.
Drilling program results confirm the robust nature of the 2023 MRE deposit model and support the high conversion percentage of 2021 Inferred Mineral Resources to Indicated and Measured categories in 2023. The associated resource expansion holes confirm the down-dip extension of the main mineralized zone’s central area and account for most of the overall increase in total deposit tonnage seen in the 2023 MRE. Much of this new tonnage is classified in the Inferred category. Figure 3 below presents an isometric view looking northeast of the deposit block model showing color-coded resource categories within the MRE pit shell.
The updated 2023 MRE is presented in the table below.
Plymouth Manganese-Iron Deposit Mineral Resource Estimate – Effective Date March 1, 2023
| Type | Mn % Cut-off | Category | Rounded Tonnes | Mn % | Fe % |
| Pit Constrained | 4.75 | Measured | 28,800,000 | 10.38 | 14.45 |
| Pit Constrained | 4.75 | Indicated | 27,900,000 | 9.74 | 13.55 |
| Pit Constrained | 4.75 | Measure and Indicated | 56,700,000 | 10.07 | 14.01 |
| Pit Constrained | 4.75 | Inferred | 17,700,000 | 10.02 | 13.62 |
Notes:
1) Mineral Resources were prepared in accordance with the CIM Standards (2014) and CIM MRMR Best Practice Guidelines (2019).
2) Mineral Resources are defined within an optimized conceptual pit shell with average pit slope angles of 45⁰ in bedrock and 20⁰ in overburden; a 3.78 :1 waste to mineralized material ratio applies
3) Pit optimization parameters include: pricing of US$1,760 (CA$2,288)/t Mn in High Purity Manganese Sulphate Monohydrate (HPMSM) containing 32% Mn, a currency exchange rate of CA$1.30 to US$1.00, mining at US$5.50 (CA$7.15)/t, a 2.5% gross metal royalty, combined processing and G&A cost (1,500 t/d process rate) at US$199.17 (CA$258.92)/t processed, and overall Mn recovery to HPMSM of 77%. Fe content did not contribute to the pit optimization process.
4) Mineral Resources are reported at a cut-off grade of 4.75% Mn within the optimized pit shell. This cut-off grade reflects the marginal cut-off grade used in pit optimization to define Reasonable Prospects for Eventual Economic Extraction using open pit mining methods.
5) Mineral Resources were estimated using GEOVIA Surpac® 2021 (Surpac) software and Ordinary Kriging methods applied to 3 m downhole assay composites. No grade capping was applied. Model block size is 10 m x 10 m x 10 m with partial percent volume estimation applied.
6) Bulk density was estimated using Ordinary Kriging methods applied to drill core specific gravity data; it is assumed that specific gravity approximates bulk density for the materials modelled. The average deposit bulk density for Mineral Resources is 3.13 g/cm3.
7) Mineral Resources may be materially affected by environmental, permitting, legal, title, taxation, sociopolitical, marketing, or other relevant issues
8) Mineral Resources are not Mineral Reserves and do not have demonstrated economic viability.
9) Mineral Resource tonnages are rounded to the nearest 10,000.
Sensitivity of the 2023 MRE to cut-off grade is tabulated below. Results show that deposit tonnages and grades do not vary dramatically within the cut-off range assessed. This is interpreted to be a reflection of both grade uniformity within the deposit and sharp grade boundaries at deposit limits.
Iron (Fe) content reflected in the MRE shows comparable contact and distribution characteristics to Mn and is reported due to potential for future by-product value additional to Mn production. It does not contribute to the current MRE pit optimization.
Plymouth Deposit Cut-off Grade Sensitivity Analysis for 2023 Mineral Resources
| Type | Mn % Cut-off | Category | Rounded Tonnes | Mn % | Fe % |
| *Pit Constrained | 4.75 | Measured | 28,800,000 | 10.38 | 14.45 |
| Pit Constrained | 4.75 | Indicated | 27,900,000 | 9.74 | 13.55 |
| Pit Constrained | 4.75 | Measured and Indicated | 56,700,000 | 10.07 | 14.01 |
| Pit Constrained | 4.75 | Inferred | 17,700,000 | 10.02 | 13.62 |
| Pit Constrained | 6.00 | Measured | 28,300,000 | 10.48 | 14.56 |
| Pit Constrained | 6.00 | Indicated | 26,600,000 | 9.95 | 13.74 |
| Pit Constrained | 6.00 | Measured and Indicated | 54,900,000 | 10.22 | 14.16 |
| Pit Constrained | 6.00 | Inferred | 17,300,000 | 10.13 | 13.72 |
| Pit Constrained | 7.25 | Measured | 27,000,000 | 10.66 | 14.78 |
| Pit Constrained | 7.25 | Indicated | 24,200,000 | 10.28 | 14.07 |
| Pit Constrained | 7.25 | Measured and Indicated | 51,200,000 | 10.48 | 14.44 |
| Pit Constrained | 7.25 | Inferred | 14,600,000 | 10.78 | 14.41 |
| Pit Constrained | 8.50 | Measured | 24,300,000 | 10.96 | 15.15 |
| Pit Constrained | 8.50 | Indicated | 20,500,000 | 10.70 | 14.47 |
| Pit Constrained | 8.50 | Measured and Indicated | 44,800,000 | 10.84 | 14.84 |
| Pit Constrained | 8.50 | Inferred | 13,400,000 | 11.04 | 14.69 |
*Notes:
This table shows sensitivity of the March 1, 2023 MRE to cut-off grade. The base cut-off value of 4.75% Mn is bolded for reference and defines the 2023 MRE reporting cut-off grade.
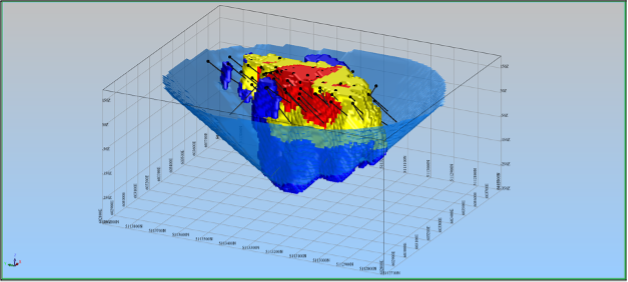
Figure : 3 Isometric view to northeast showing 2023 MRE block model with constraining pit shell, drill hole traces, and color-coded MRE categories (Red=Measured, Yellow=Indicated, Blue=Inferred)